Croatian employee satisfaction and engagement pulse is a research conducted by Luppa on a sample of over 4.000 respondents. It analyzes the satisfaction and engagement of employed Croats in great detail, who, on a scale of 0 to 5, gave their satisfaction a grade of 3.
How satisfied are employees in Croatia?
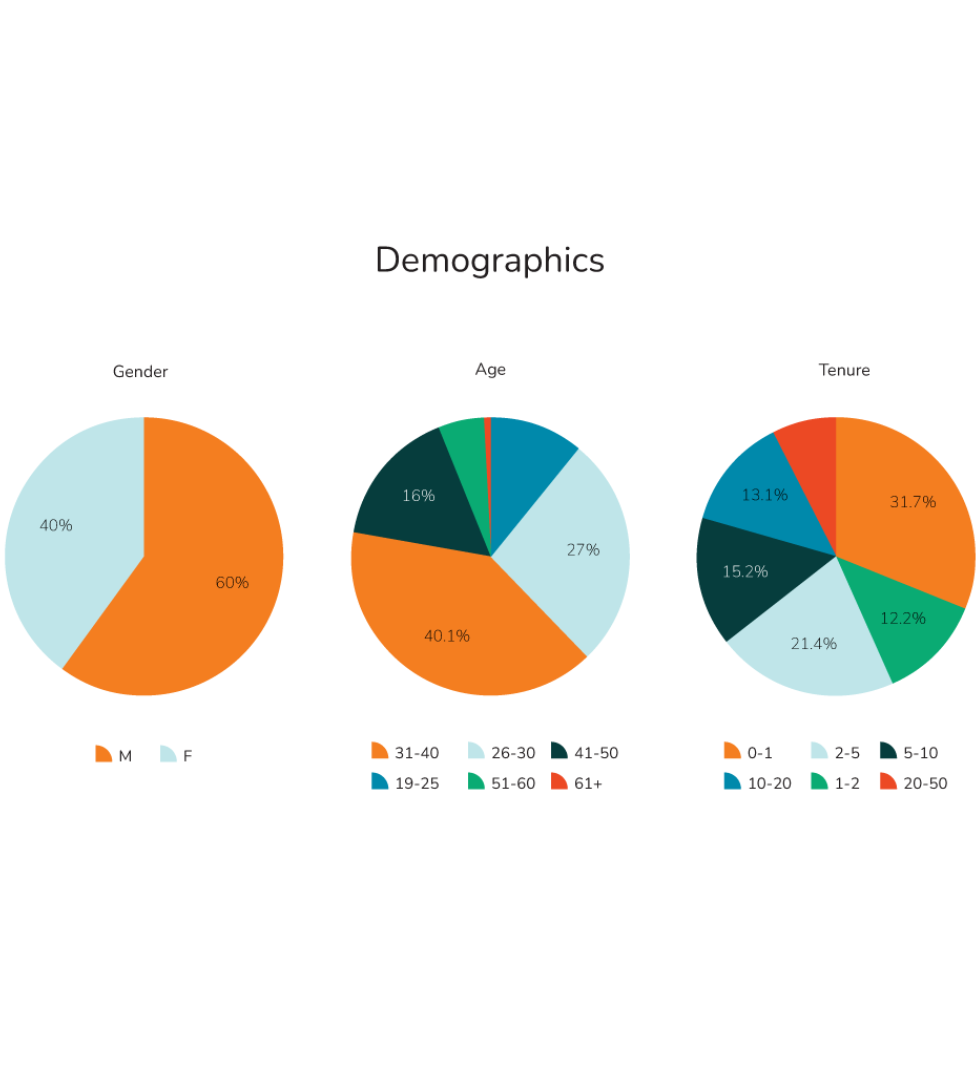
In a sample of over 4.000 respondents, of which 60% were men and 40% were women, the majority were in the age group 31-40 – 40% of them. Still, all age groups are represented in the survey, and the seniority of the respondents is also known.
In the survey, Croatian employees assessed their satisfaction on a scale where 0 means “I don’t agree at all” and 5 means “I completely agree”.
The survey, through about 100 questions, examines 12 dimensions of job satisfaction: changes and innovations, engagement, cooperation, balance between business and private life, communication, working conditions, learning and development, vision and meaning, autonomy, leadership, work organization, and loyalty.
The research showed that Croats are the most satisfied with the engagement they get from work and cooperation among colleagues and the least satisfied with the balance between private and business life. Though the difference is only one grade, it is significant on a scale of 0-5.

The questionnaire requires the respondents to enter the industry in which they work so that a general analysis can be made and the respondents can compare their results with those of the industry in which they work.
The most satisfied are people in the IT industry – their average satisfaction is 3.49, followed by the automotive industry, whose average satisfaction is 2.92 out of 5. The public sector is the most dissatisfied – the average satisfaction of people employed is only 2.01.

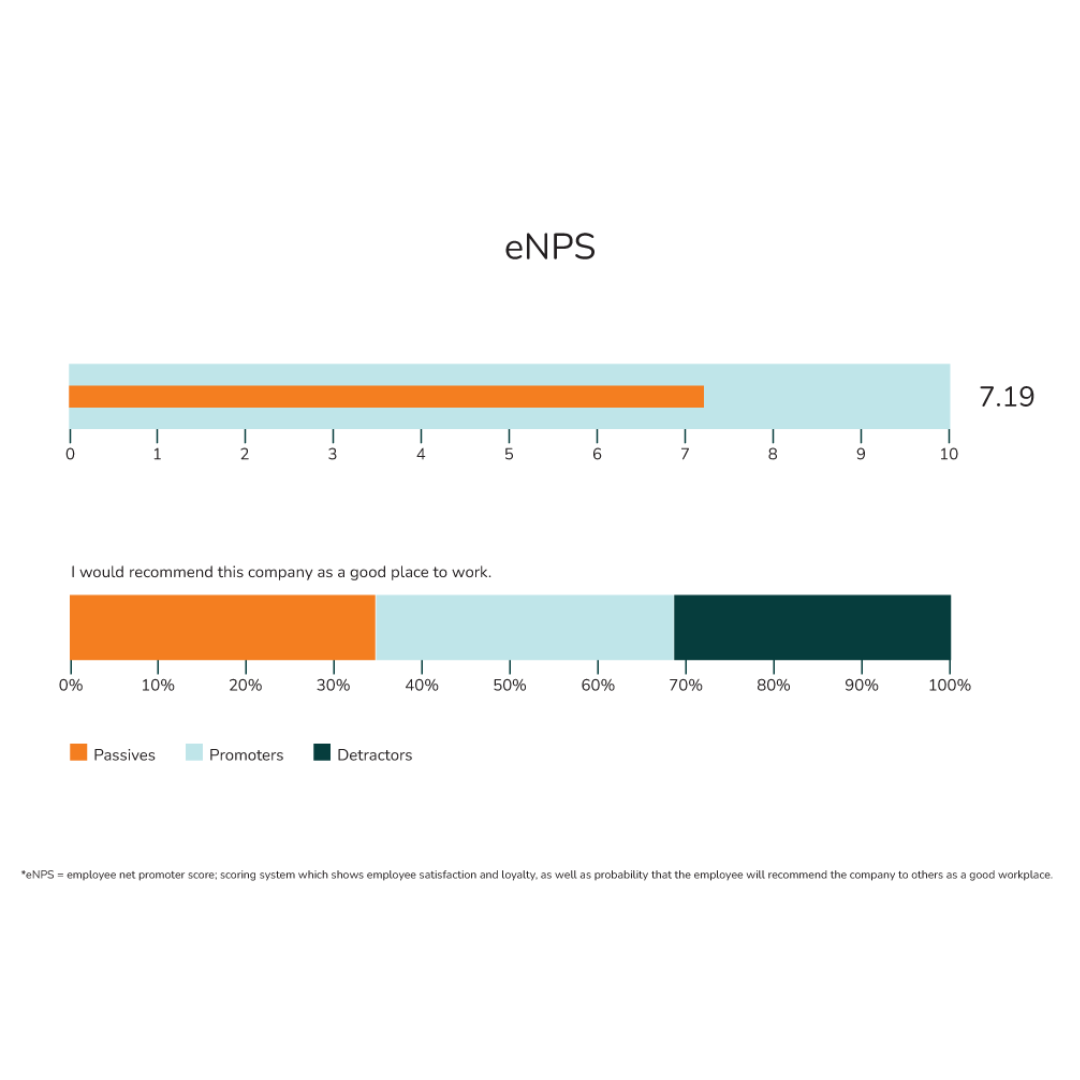
eNPS is the employee net promoter score, a metric that shows the probability that an employee will recommend the company to others as a good workplace, and eNPS Croatia is 7.19 on a scale of 10. Among the respondents, there is an equal ratio of promoters – those who will recommend their company, to passives – those who will by no means recommend their company as a good place to work. If you're interested in the difference between eNPS and engagement, read our blog on the topic.
This is what it looks like on the industry level in Croatia:
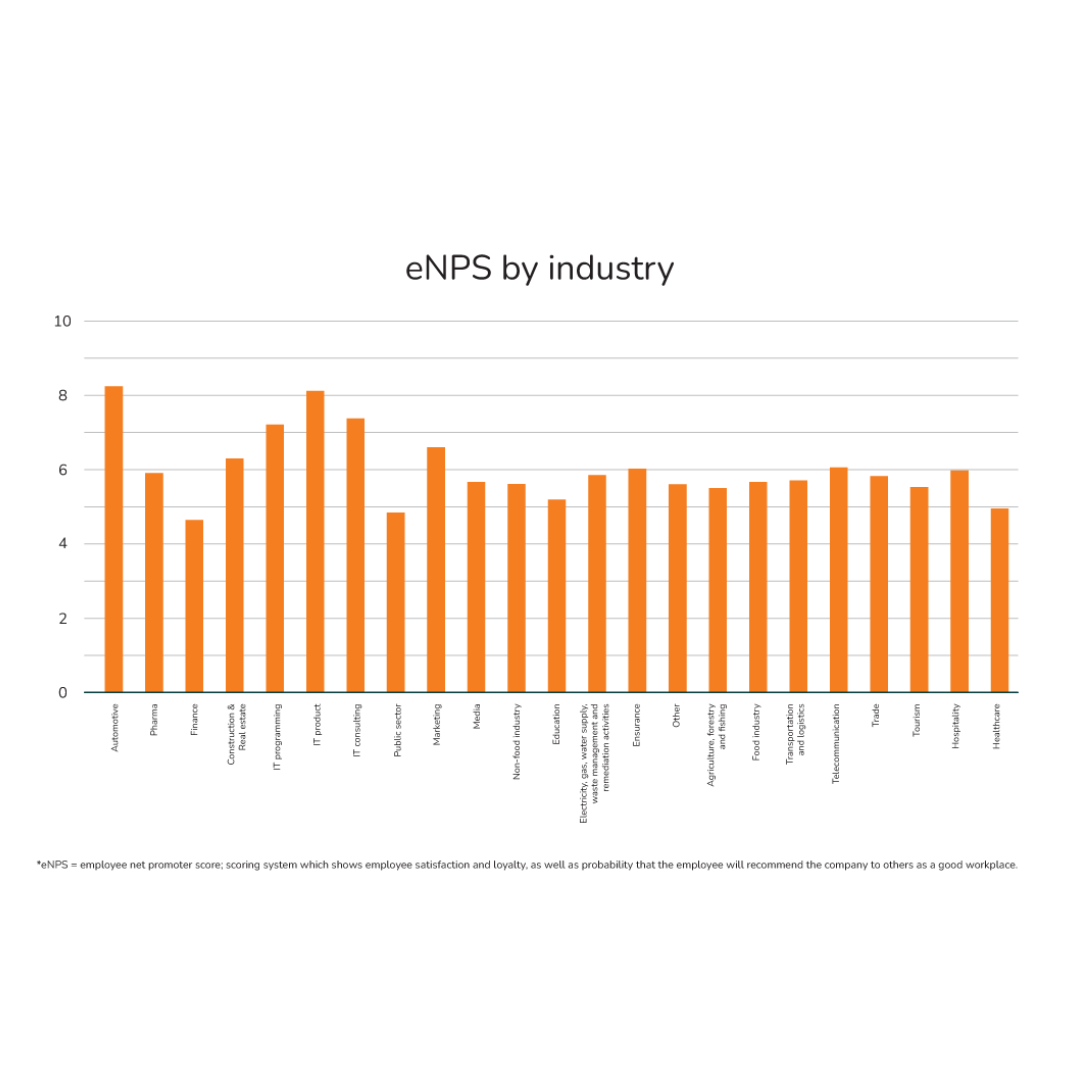
The likelihood that employees will recommend a company as a good workplace varies across industries.
The automotive industry received the highest rating – above 8- followed by IT and marketing. Those employed in finance would least recommend their employer, as well as those least satisfied in Croatia – the public sector.
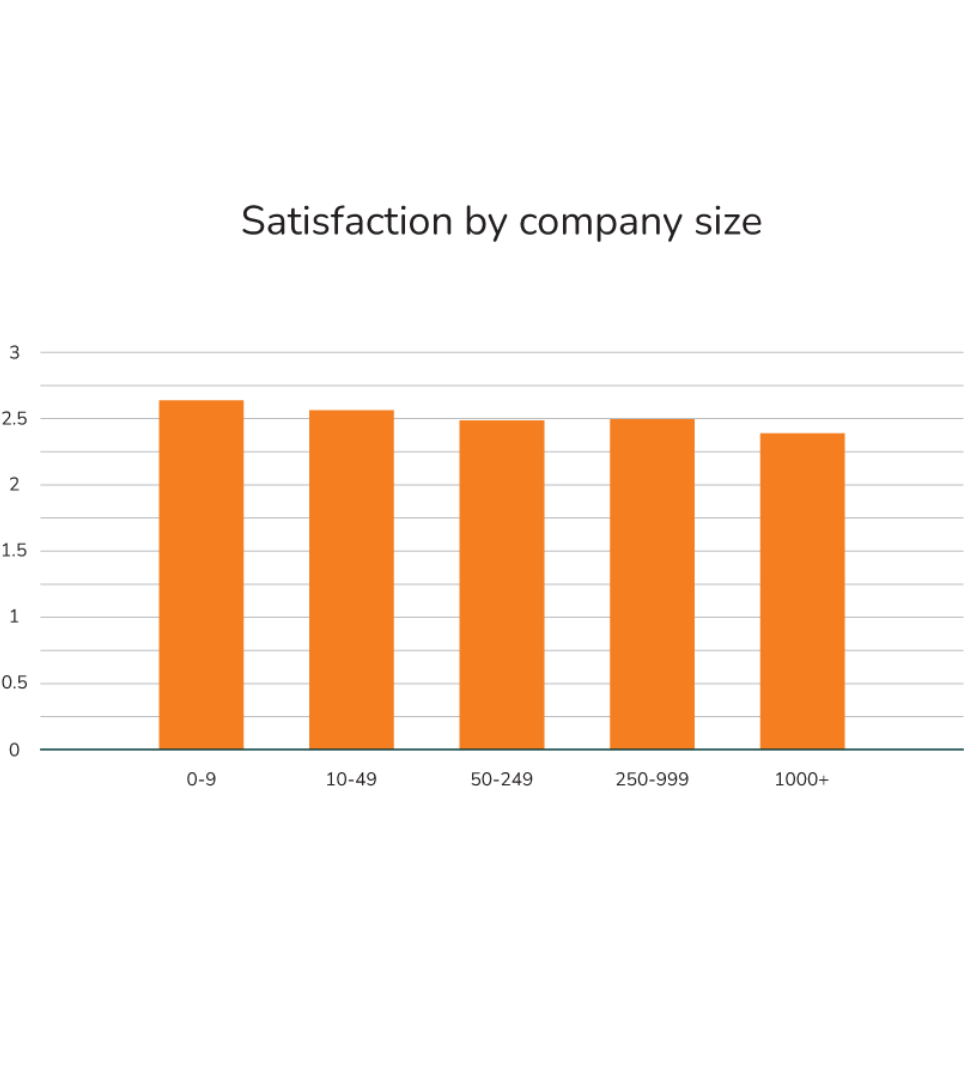
The happiest are people who work in companies with up to 9 employees, and the least satisfied are those who work in large systems with over 1.000 employees. Still, the satisfaction levels do not fluctuate wildly, so there are no significant differences in satisfaction in Croatia concerning the company’s size.
Age is not a factor that significantly affects satisfaction – although in Croatia, those just at the beginning of their career are the most satisfied, all age groups rated their satisfaction between 2.42 and 2.64.
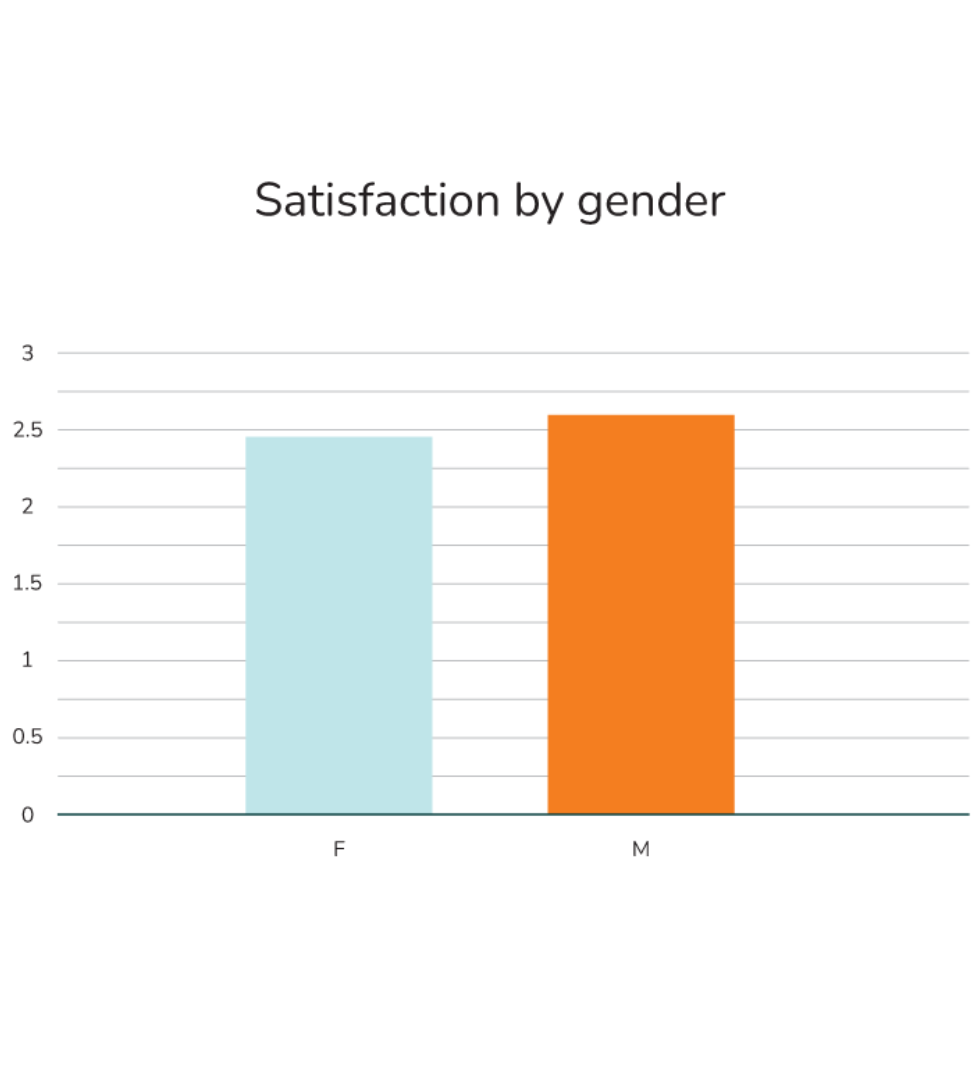
Comparison by gender
In Croatia, women are less satisfied with their jobs and employers than men. However, the overall difference in satisfaction tells us little about the reasons for this difference, so it is essential to check the differences in individual dimensions of job satisfaction and the differences between industries.
For both men and women, those in the IT sector are among the most satisfied. Compared to other women, those in the IT sector are the most satisfied with various aspects of work. Men employed in the IT industry are the second most satisfied, following the automotive industry.
A more detailed analysis of the differences by individual dimensions showed that, although generally, women show a lower degree of satisfaction than men on most dimensions. The biggest differences are shown in the dimensions related to satisfaction with cooperation with colleagues and satisfaction with superiors.
At the same time, the answer to one claim is particularly interesting. Namely, men mostly agreed with the statement “The company respects diversity, and there is no discrimination on any basis” – expressly, 78% of men and 65% of women agree. This means that in Croatia, women perceive more discrimination and disrespect in the workplace than men.
In addition, although the difference in working conditions was generally not that significant, the answer to the question about salary satisfaction stands out – 36% of women are not at all satisfied with their salary and believe that it is not in line with their knowledge, skills, and responsibilities, while 25% of men think the same.
Women are also much less satisfied with the education they receive and the plans for their further development and advancement compared to men.
The issue of the balance between work and private life is becoming increasingly relevant, so we took a closer look at the gender differences in this matter. And while an equal percentage of men and women stated that they often have to work overtime and that work demands interfere with their private and family life almost equally – about 35%. 39% of women, compared to 50% of men, state that they can completely relax in their free time.
Business Psychology Lab explains: This finding probably stems from the fact that a greater share of housework and child care still “falls” on women and is commonly found in the research literature as well. For example, in a study on adaptation to working from home that we conducted during the pandemic, it was found that women who worked from home had a lower degree of subjective well-being than men (even though their productivity was equal). The reason for this was probably the greater burden of personal and family obligations, which makes it difficult for them to recover from work.
It seems that all this was reflected in the probability of recommending the company as a good place to work – 38% of men would recommend their company as a good place to work, and even 44% of women would not do so at all.
Finally, this is also reflected in the loyalty assessment – women are much less loyal to their organization and are ready to leave it if a better opportunity presents itself.
Comparison by age
Although age is not a factor that significantly affects job satisfaction among Croats, it is interesting to consider the differences by dimensions of job satisfaction and industry to obtain clear conclusions.
Although, in general, the scores on the dimensions of job satisfaction do not differ by age group, some interesting things can be noticed. Respondents of all age groups are most satisfied with the cooperation and engagement provided by the job.
At the same time, young people are most satisfied with the fact that their employer respects differences and there is no discrimination, and they have opportunities to develop friendships.
Also, as many as 80% of young people claim that they care about the success of the company they are employed at and almost as much about its reputation outside the workplace.
As for general working conditions, it is interesting that more than one-third of Croats under 30 and over 50 believe their salary does not align with their knowledge, skills, and responsibilities. Those in their middle age are the most satisfied with their salary – 31% of them stated that the salary is in accordance with the mentioned criteria.
Although the differences between business and personal balance are not great, it is interesting to point out that many employees agree with the following statement: “I often feel “drained” because of work.”.
Young people feel it the most, 28% of them, middle-aged in 23% of cases, and 20% of people over 50 feel this way.
A more detailed look at satisfaction with different aspects of leadership shows that young people show a certain level of dissatisfaction there. Among those under the age of 30, 42% believe that what they do in their position should be done differently, and 39% would make decisions completely differently.
Finally, in terms of satisfaction with learning and development, it turned out that older workers are much less satisfied with the answers to questions related to their development in the company. As many as 40% of employees over 50 and between 31 and 50 years of age state that they do not have a defined development plan to further improve their competencies. Part of this can be explained by the fact that some of these workers, especially those older than 50, do not need to further improve their competencies.
Business Psychology Lab commented on these data the following: Although the argument can often be heard that older workers no longer have the will for further development and advancement, it seems to us that this data reflects one of the findings from the European Working Condition Survey (EWCS), a large European research on representative samples of workers. Comparisons of older and younger workers based on these data show that older workers are generally less valued in Croatia, which could be a manifestation of that problem.
Similar to the data above, the probability of recommending a company as a good workplace also seems to decrease with age. Thus, those under 30, who are usually at the beginning of their careers, would recommend their employer to the greatest extent – more than 38% of them would do so, while 31% of people aged 31-50 and only 27% of people over 50 would do so.
With age and experience, satisfaction with work-life balance increases, while satisfaction with vision and purpose, leadership, communication within the company, and learning and personal development decrease. Loyalty is lowest in the 31-50 age group.
Marketing
People employed in marketing rated the overall satisfaction with 3.53, and the employee net promoter score on a scale of up to 10 was rated 6.33, a surprising figure that indicates that over 47% of employees would not recommend their company as a good place to work. Only slightly less than 17% of those in the marketing industry would do this.

Those employed in small companies with up to 9 employees are the most satisfied, while those with over 1.000 employees are the least satisfied. The differences between the sexes are slight – women, with a rating of 2.52, are slightly more satisfied than men, who rated 2.43. There are bigger differences between age groups: people in the 51-60 age group rated their satisfaction with 3.32, followed by the 41-50 age group, and the least satisfied are those in the 31-40 age group, whose average rating is 2.41, significantly lower than the group that proved to be the most satisfied with their work.
Among the 12 examined dimensions, the factors related to the cooperation dimension received the best ratings – this dimension was rated 3.46, followed by autonomy and engagement, and the loyalty dimension received the significantly lowest rating – only 1.87 on a scale of 0-5.
The best-rated statement is the one that says, “Differences are respected in the company, and there is no discrimination on any basis”. 55% of marketing employees fully agree, and almost 30% agree at least partially. Only a little over 2% disagree entirely with this statement, so it can be concluded that equality and non-discrimination are valued in marketing, and these values are respected.
The best-rated statements are also those that people in marketing have good opportunities to develop friendly relationships at work, that they are provided with suitable equipment for work, and that their legal rights are respected. Similar statements were among the best-rated ones in the IT industry as well.
The worst rated was the statement that claims, “I would be happy if I spent the rest of my career in this company” – 44.44% of people who filled out the questionnaire completely disagreed with it, and only 4% completely agreed with it. These results align with the loyalty rating, which is the lowest-rated dimension in marketing among the 12 examined. However, if we are interested in the loyalty of those who are just at the beginning of their career, between the ages of 19 and 30, the results are even worse – their loyalty rating to their employer is just 1.62.
Here’s what else Croats are not satisfied with in marketing:
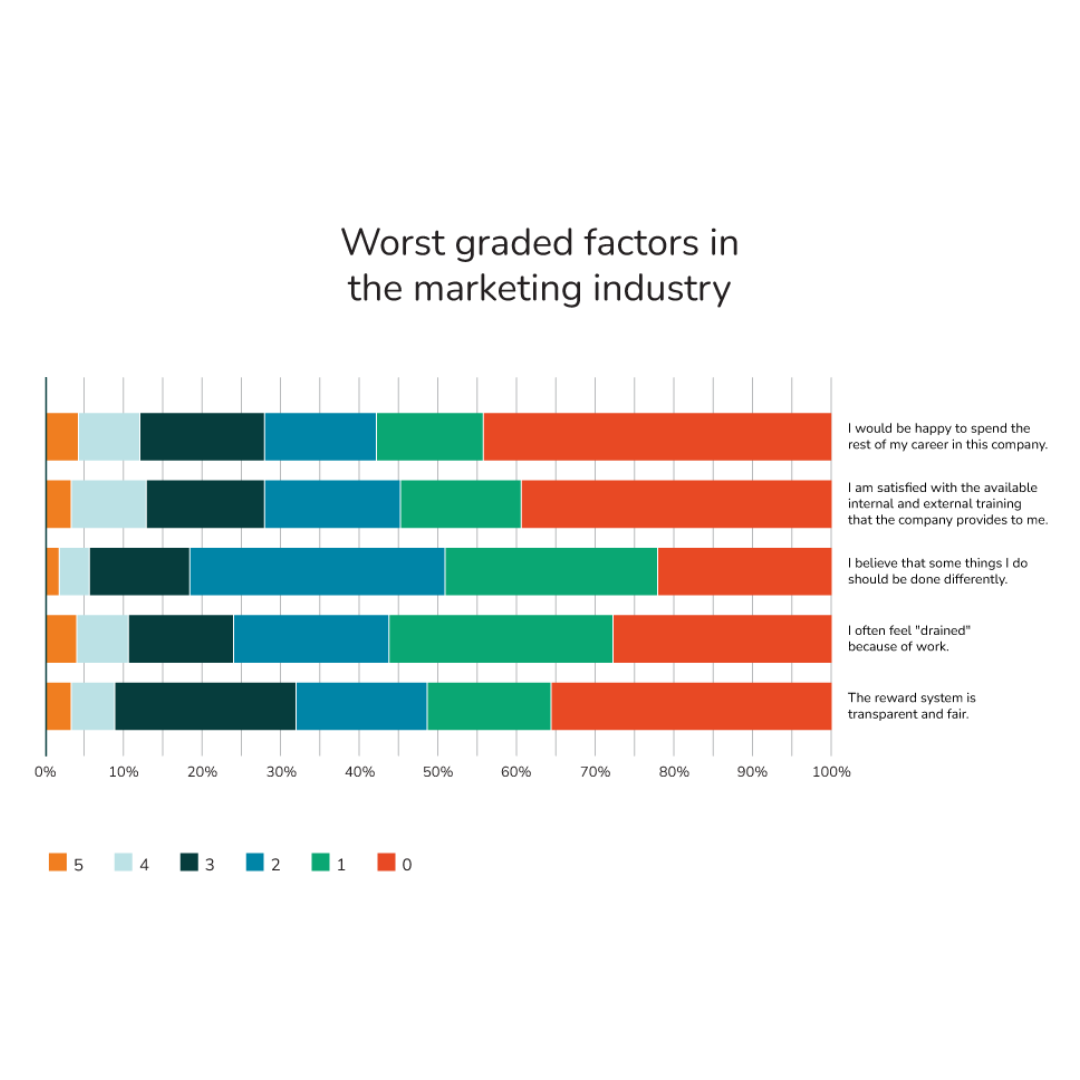
The reward system in marketing is not transparent and fair – it did not receive a passing grade, just as benefits, salaries, and the dynamics of advancement did not. But at least work is done with quality equipment that is rated 4!
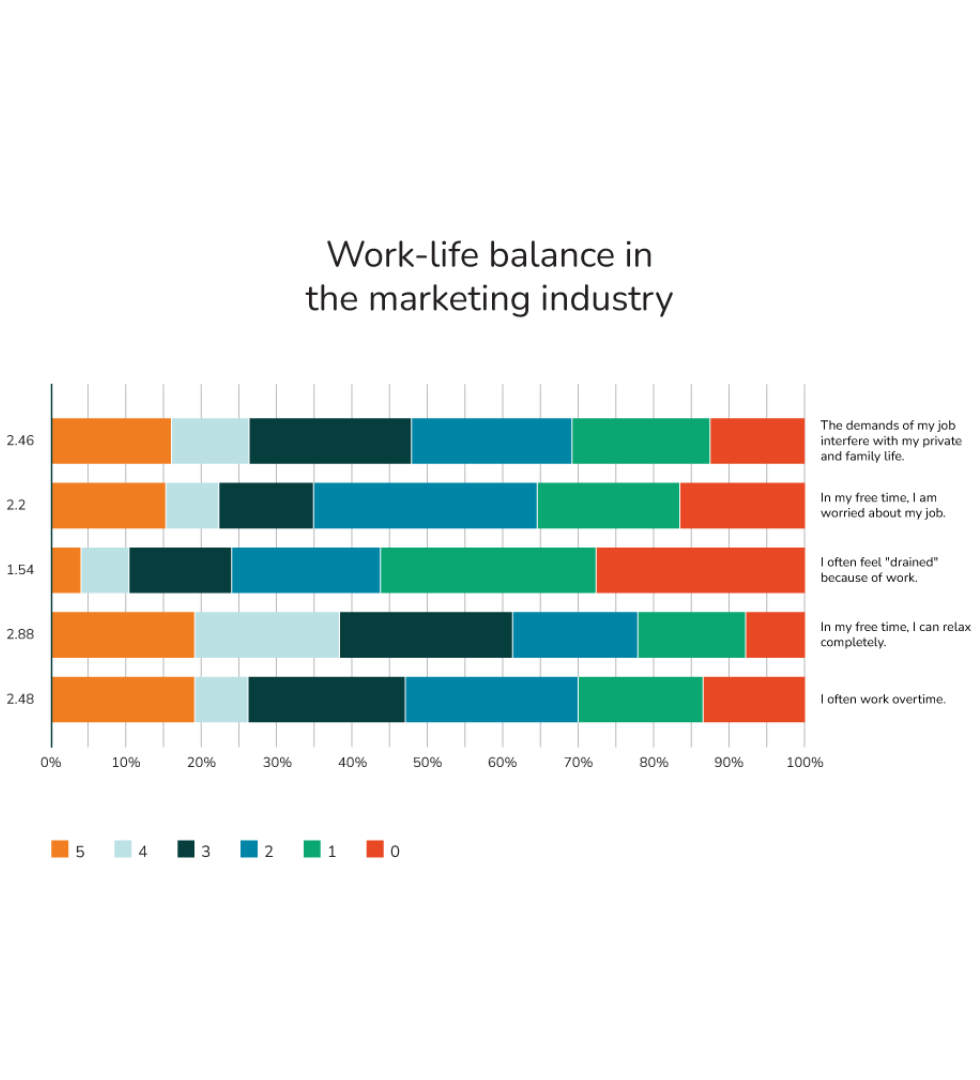
Marketing is a dynamic industry, which can be seen in the evaluations that examine work-life balance. No examined factor received a score of 3 or higher. It is sufficient information that almost a third of respondents claim that they often work overtime or that around 25% of people stated that their work interferes with their private and family life.
IT
Women in IT are slightly more satisfied than men – they rated their satisfaction with a score of 3.15, while the male gender gave a score of 2.9, which is an interesting fact and an exception compared to most other industries.
Age does not significantly affect the satisfaction score, which ranges between 2.83 in the 51-60 age group and 3.06 in the 26-30 age group.

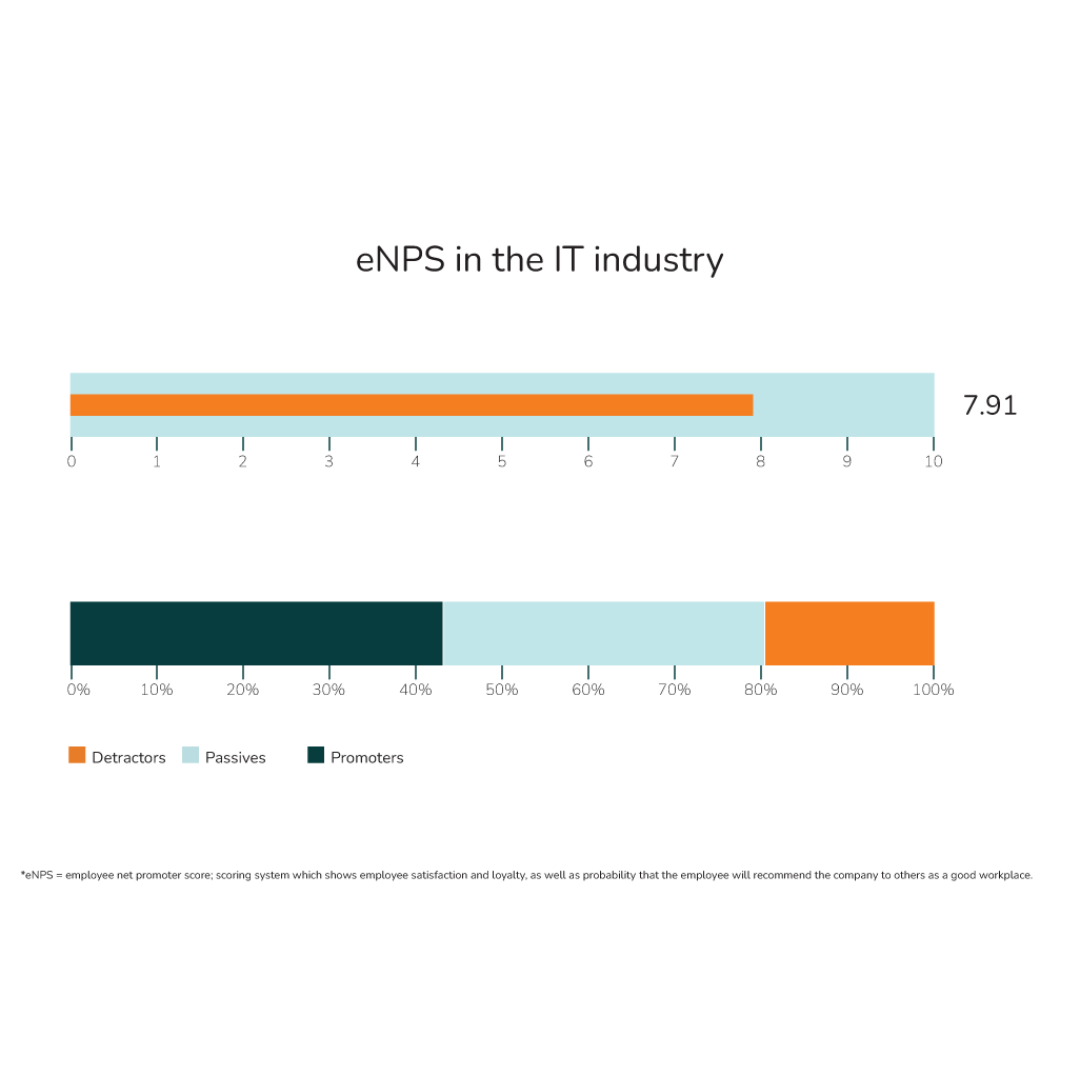
eNPS in the IT industry is rated with a high grade of 7.91 out of 10, and 43% of people employed in IT would recommend their company as a good place for work, whereas 20% of them wouldn’t do it.
The best-rated of the 12 examined dimensions is cooperation, which received a rating of 3.72, followed by the dimension of engagement, rated 3.42, which means that employees in the IT industry value good relations and cooperation between teams and colleagues but also that they are engaged employees to their employer.
However, loyalty is the lowest-rated dimension, but the difference is not significant, and it is rated 2.77. Perhaps expectedly, one of the worst-rated dimensions is the work-life balance, which received a rating of 2.78.
Within the IT industry, those who work in consulting are the most satisfied, followed by programmers, and those who work in product development are the least satisfied. Employee net promoter score follows satisfaction, so the biggest promoters of their company and industry are those who work in consulting, then programmers. Ambassadors are, to the smallest extent, those who deal with product development.
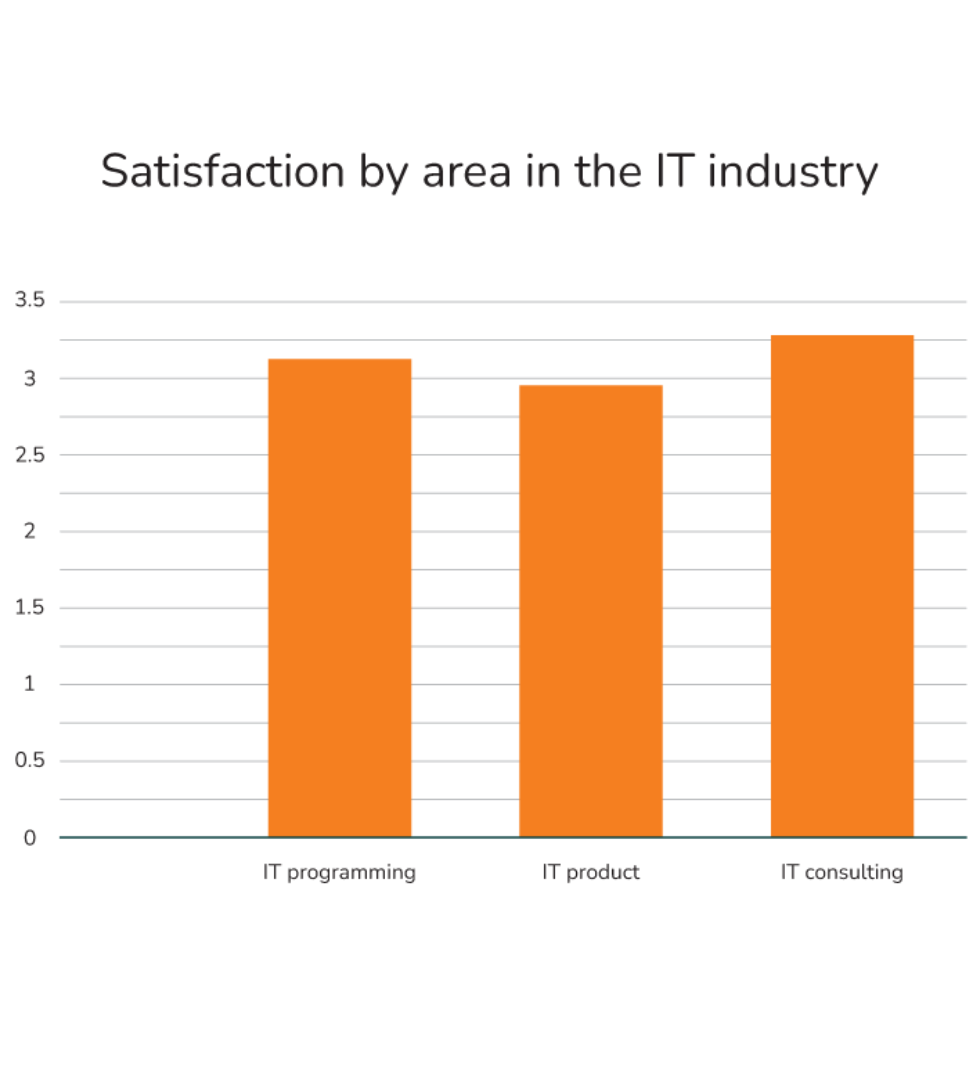
In the IT industry, the employees are the most satisfied with respect for their legal rights, work equipment, and the fact that there is no discrimination and diversity is respected. Given that it is the most satisfied industry in Croatia, it is not surprising to learn that over 70% of people care about the success of the company in which they work. The fact that more than 78% of employees have the opportunity to develop friendly relationships within the company probably contributes to their satisfaction.
However, some of the problems in the IT industry are unclear work tasks, non-transparent and unfair reward systems, and decision-making.

As the best-rated category, cooperation points out that employees especially value respect for diversity, absence of discrimination, development of friendly relations, pleasant working atmosphere, and openness to express their opinion.
The data concerning the balance between private and business are interesting: about 45% of employees in the IT industry said that they often work overtime, about 41% say that it interferes with their private and family life, but still, about 50% of them say that in free time can completely relax, and 26% of IT employees often feel drained by work.
In short, although work in IT is demanding, it does not affect most of them negatively – there is a balance between private life and work.
When it comes to working conditions, employees in the IT industry are by far the most satisfied with respect for legal rights, which should be the standard. However, in comparison, while in IT, the best-rated industry, 93% of people stated that their legal rights are respected, in the public sector, whose satisfaction is only at 2.01, over 28% stated that law rights protect their legal rights are at least partially not respected.
Loyalty received the lowest rating among the 12 dimensions in the IT industry.
As many as 62% of IT workers are actively looking for another job. At the same time, it is interesting that no person belonging to the age group 51-60 stated that they are not looking for another job at all, and 68% of them said that they fully agree with the statement that they are actively looking for a new job.
Different answers were given by the age group 26-30: 7.59% said that they are not looking for another job at all, while 46.84% of them answered “I completely agree” when asked if they are actively looking for a new job.
Do you want to receive your satisfaction analysis and industry & market comparison?
Personal Luppa survey uses the same questionnaire used for satisfaction research within companies and was developed in cooperation with the Business Psychology Lab. It consists of about 100 questions, only takes about 10 minutes to complete, and the person receives an analysis of their satisfaction by email and comparison to the industry and the market.
If you want to get the analysis and comparison of your results, fill out the Personal survey for free here.
