
tl;dr
Extensive analysis across a wide range of employee surveys reveals clear patterns that drive higher response rates. Surveys launched early in the week, during spring months, and kept short tend to perform best. Broad accessibility, timely reminders, and clear communication also play a key role. Most importantly, when employees see their feedback leads to action, response rates rise. These findings are grounded in real data—and can help you design smarter, more effective surveys.
Introduction
When is the best moment to launch Deep Dive - an annual employee engagement and satisfaction survey? Are there certain conditions that can lead to better response rates and ensure you’re collecting data that truly reflects your organization? And just as importantly: how do your response rates compare to others - are they above or below the average?
According to various studies, small but carefully considered adjustments can lead to a 10-20% increase in response rates, significantly boosting both participation and the quality of data you collect. The key to success lies in optimizing these adjustments, as they can have a meaningful impact on engagement and response rates when fine-tuned.
So what makes people more likely to respond?
To find out, we analyzed a wide range of Deep Dive surveys run by our clients across different industries, company sizes and time periods - drawing from approximately 40,000 data points. Our goal: uncover the patterns that drive participation and identify what really makes a difference when it comes to getting employees to engage.
In this blog, we’ll share data-backed insights into the key factors that influence response rates - from the day of the week and the duration of the survey, to the number of reminders sent, the season of the year and the length of the questionnaire. These findings can help you plan your future surveys more effectively and offer valuable guidance when advising clients or stakeholders.
What is the response rate?
Response rate is the percentage of individuals who completed a survey out of the total number of people who were invited to participate. It is calculated using the formula:

Why are survey response rates important?
A high response rate isn’t just a number - it plays a key role in shaping how useful, reliable and actionable your survey results are. More specifically, it contributes to:
Representativeness
When more employees participate, the survey results are more likely to reflect the views and experiences of your entire workforce, not just a specific group. This makes the data more accurate and gives HR and leadership teams a clearer picture of what’s really going on in the organization.
Reduced non-response bias
Low participation can lead to skewed results, especially if only certain types of employees choose to respond (e.g. only the most dissatisfied, or only the most engaged). A higher response rate helps reduce this kind of bias, ensuring that the feedback reflects a balanced range of voices across departments, roles and locations.
Increased confidence in results
With more responses, you’re working with a stronger data set. This means you can draw conclusions with greater certainty, track trends more effectively and make informed decisions that are based on a solid foundation - rather than guesswork or partial information.
Higher employee engagement and trust
Response rate can also be a signal in itself. When employees take the time to give feedback, it often means they believe their opinions matter and that the company is genuinely listening. On the other hand, low response rates might point to a lack of trust in the survey process or a belief that nothing will change.
Simply put, a higher response rate leads to better data, stronger insights and more confident action. It allows companies to truly understand their employees and take meaningful steps toward improving satisfaction, engagement and workplace culture.
Key factors influencing response rate
1. Company size
Smaller companies (10-49 employees) achieve the highest response rates, with an average of 87.15%, while larger companies (5000+ employees) report the lowest response rates at 38.16%. This trend is expected - it's easier to secure engagement in smaller teams, where communication and coordination are more straightforward. However, in larger organizations additional effort is required to reach and motivate a larger, more diverse group of employees.
In practice, effective communication is crucial for improving response rates in larger companies. Team leaders should be proactive in explaining the importance of the survey, ensuring that employees understand how their feedback will lead to actionable plans and improvements. By providing clear expectations and timely updates on how results will be used, companies can build trust and increase participation.

2. Industry
The response rates vary significantly across industries, with certain sectors standing out for their high engagement levels.
The pharmaceutical and healthcare industry achieved one of the highest average response rates at 87.71%, followed by professional services (HR, marketing and other) at 84.59% and the financial sector at 81.17%. These industries likely benefit from well-established communication channels and a strong culture of feedback.
Industries like IT (79.01%), the non-food industry (76.56%), and media (76.17%) demonstrate solid response rates, reflecting their structured approach to survey distribution and the value placed on employee input. The automotive industry also performed well, with a response rate of 75.57%, likely due to its focus on continuous improvement and employee involvement.
On the other hand, industries such as trade (70.82%), construction and real estate (67.02%), and hospitality (65.69%) fall towards the lower end of the spectrum, indicating potential opportunities to strengthen engagement efforts. Sectors like transportation and storage (58.56%) and the public sector (45.16%) showed notably lower response rates, indicating room for improvement in engagement efforts.
These findings suggest that industries with a strong focus on communication, technology and centralized engagement tend to achieve higher response rates, while sectors with more fragmented workforces or less digital integration struggle to maintain high participation levels.

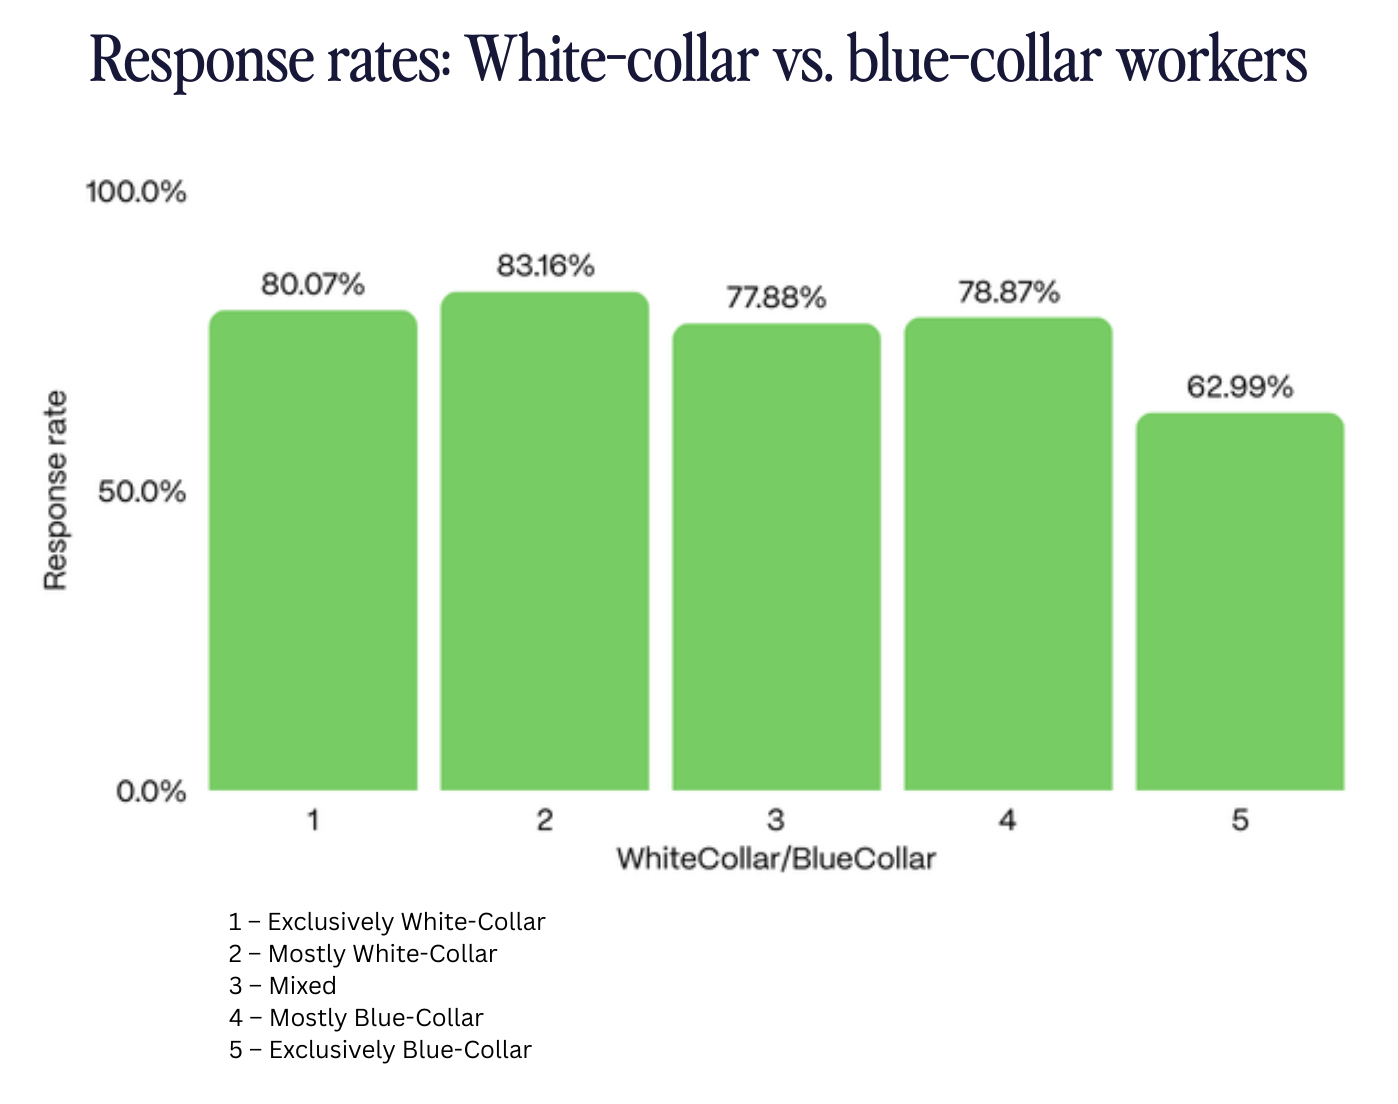
3. Employee type (White-collar/Blue-collar)
The data reveals that response rates vary depending on the type of workforce - whether it is predominantly White-collar, Blue-collar, or a combination of both. White-collar workers tend to show higher response rates (81.08%), likely due to their more accessible work environment and greater exposure to digital communication.
As we move towards a more Blue-collar workforce, the response rates tend to decrease (62.99%), suggesting that employees in more manual or physically demanding roles may be less engaged in survey participation. However, companies with a balanced mix of both types of workers see relatively high response rates, indicating that clear communication strategies targeting both groups can help boost engagement across the board.
In summary, it's crucial to provide all employees with easy access to the survey. To increase response rates, we implemented multiple channels for distributing the survey. This includes email, SMS/WhatsApp/Viber, printed QR codes and a central station setup, where multiple workers can complete the survey individually on a shared computer. These efforts ensure that employees have the flexibility to choose the most convenient method for responding, ultimately helping to boost participation across different work environments.
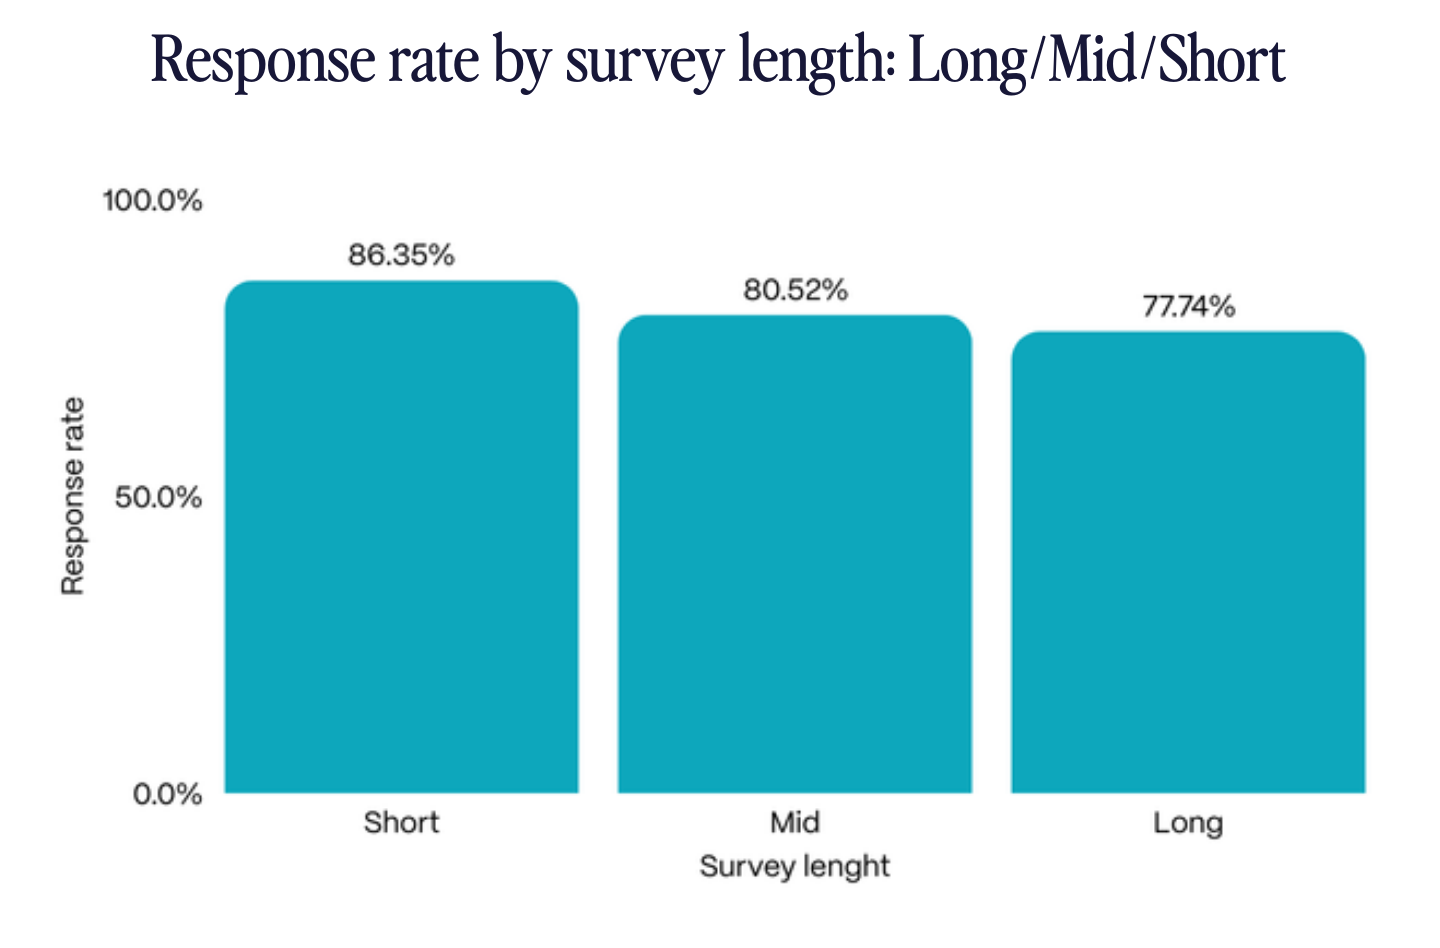
4. Survey length
As expected, shorter surveys achieved the highest response rates in our analysis, averaging 86.35% well above mid-length (80.52%) and long surveys (77.74%). This finding aligns with a common principle in survey design: the shorter the questionnaire, the lower the barrier to participation.
Shorter surveys are quicker to complete, which reduces the perceived time and effort required from respondents. In busy work environments where employees are often balancing multiple tasks, even small time savings can make a difference in their willingness to engage. A concise format also signals that the organization values their time and is focused on gathering only the most essential feedback.
That said, while short surveys perform best in terms of pure response rates, the relatively high participation in longer formats suggests that length alone isn’t an obstacle as long as the content feels relevant and meaningful. Still, when response rate is a key priority keeping surveys brief can be a particularly effective strategy. For more insights on how to choose the right lenght for your surveys, read our blog on the topic.
5. Survey duration
Our data shows that surveys kept open for just one week had the highest average response rate (83.92%), suggesting that a shorter window may be most effective in encouraging participation.
A two-week duration also performed well, with a response rate of 80.78%. However, by the third week, response rates began to decline more noticeably, dropping to 74.85%.
These findings suggest that keeping the survey window relatively short may help maintain a sense of urgency and encourage timely participation. However, if the survey period falls within times of high employee absence such as during major vacation seasons, it may be advisable to extend the duration slightly to ensure all employees have a fair chance to respond.

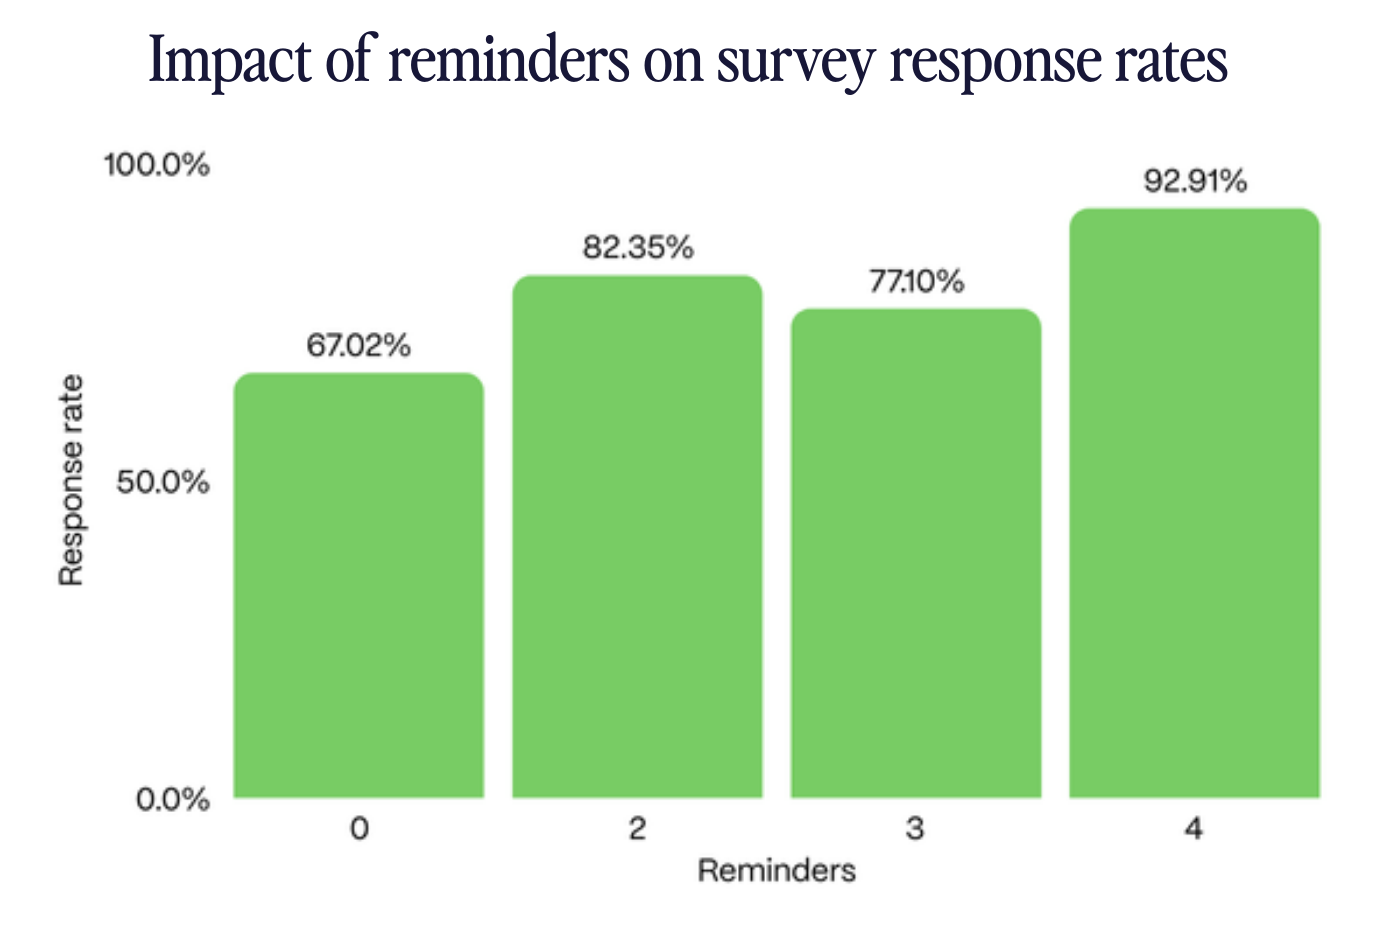
6. Reminders
Surveys with four or more reminders achieved the highest average response rate by far - an impressive 92.91%. This suggests that persistent follow-up can be highly effective in driving participation. In contrast, surveys without any reminders had the lowest response rate at just 67.02%, highlighting the importance of follow-up communication.
While two reminders also yielded a solid result (81.74%) and may represent a practical approach in many situations, three reminders showed a slight decline in effectiveness (77.88%). These findings indicate that although fewer reminders can work well, a more consistent and sustained follow-up strategy may lead to the best outcomes.
This aligns with external research, which recommends that striking the right balance between a helpful nudge and overwhelming communication can significantly improve response rates - by up to 36% (Qultrics). It’s recommended that reminders are written with slightly different wording to keep the message fresh and avoid repetition - a small adjustment that can help sustain attention and improve response rates.
7. Day of the week
Our analysis showed that response rates tend to be highest at the beginning of the week, with Monday and Tuesday consistently showing the strongest results. On Monday, the response rate was 78.18%, while Tuesday saw an even higher rate of 82.12%.
These results align with findings from other studies, which consistently suggest that Monday and Tuesday are the best days to send out surveys. For instance, research published in the Springer Nature journal by Wolff and Goriz (2021) found that surveys sent earlier in the week achieved significantly higher response rates compared to those sent later in the week.
Employees may be more receptive to participating early in the week, when routines are reestablished and focus levels are higher. In addition, launching surveys at the start of the week allows more time for reminders and gentle follow-ups, which can help maintain momentum and drive completion.

8. Month / Season
Looking at monthly trends, the highest response rates were observed in spring months, particularly in March (80.52%), April (94.54%) and May (85.18%), suggesting that this period may be the most effective for survey distribution.
In contrast, summer (June: 75.50%, July: 86.29%) and late autumn/winter months like October (62.21%) and December (78.09%) showed notably lower response rates.
This pattern may reflect the impact of holidays (Alchemer), vacations and year-end workloads, making it advisable to avoid launching surveys during major holiday seasons and instead focus on more stable, less disruptive periods like spring.

Practical recommendations to maximize response rate
If you want to increase participation in your employee satisfaction surveys, here are some clear, proven tips to help you boost response rates:
- Explain the “why” clearly - Ensure that team leaders actively communicate the purpose of the survey, why it matters and how the results will be used. When employees understand the value of their feedback and see that it leads to real action, they’re far more likely to participate. Clear, authentic communication builds trust and increases participation.
- Launch surveys early in the week - Monday or Tuesday brings the highest response rates.
- Choose spring (March - May) - This is when participation peaks. Avoid summer holidays and year-end periods.
- Keep the survey window short - One to two weeks is ideal for maintaining urgency.
- Reminders matter - it’s always worth sending a friendly nudge to keep participation high. In addition, consider using slightly different wording each time to keep the message fresh and engaging.
- Make access easy - Use multiple delivery channels to reach every employee, especially those without digital access. Combine email, WhatsApp/Viber, QR codes or shared computers to ensure all employees can participate. Choosing the right survey delivery methods can significantly impact response rates and data quality.
- Keep it short - employees are more likely to respond when the survey is concise and respects their time.
- Act on feedback - Thank employees for participating, share results and openly communicate upcoming steps and action plans.
For more actionable strategies to improve participation, explore our guide on how to maximize response rates in employee engagement and satisfaction surveys.
Conclusion
Boosting survey response rates isn’t about luck - it’s about smart planning. By choosing the right timing, making surveys accessible to everyone and clearly communicating the value of participation, companies can gather more accurate, representative feedback.
These insights not only strengthen decision-making but also build trust and engagement across the organization. With the right approach, your next survey can deliver the insights you really need to drive meaningful change.
However, understanding your response rates is just the first step. To ensure the data you collect is accurate, reliable, and interpreted correctly, our Employee Engagement Analytics ebook explains the foundations of sound measurement - from choosing the right indicators to understanding how benchmarks and scoring systems shape your results.
Want to create a feedback culture where employees feel heard and engaged? Continue reading our blogs to learn more, try our ROI calculator to see how much could you save investing in your employees—or contact us to see how Luppa can help you drive participation, track sentiment, and turn insights into action.